Introduction
Ever wondered how traders seem to predict market moves with such precision? It’s not magic it’s understanding chart patterns. If you’re looking to get a better grasp of trading or investing, knowing key chart patterns is essential. Whether you're a beginner or an experienced trader, this guide will simplify these concepts for you.
Imagine chart patterns as the footprints of the market. They tell you where prices have been and hint at where they might go next. In this article, we’ll break down essential patterns you need to know so you can trade with confidence.
1. What Are Chart Patterns in Trading?
At its core, chart patterns are visual representations of price movements. They form shapes or "patterns" that traders use to predict future trends. Think of it like weather forecasting patterns from the past help you prepare for what might come next.
2. Why Are Chart Patterns Important?
Why should you bother learning chart patterns? Here’s why:
Identify Market Trends: Understand whether prices are going up, down, or sideways.
Timing: Chart patterns help you find the best time to buy or sell.
Improve Decision-Making: Patterns reduce guesswork and add a structured approach.
3. Types of Chart Patterns
Chart patterns are broadly classified into two types:
Reversal Patterns – Indicate a change in the current trend.
Continuation Patterns – Suggest the existing trend will continue.
4. Reversal Patterns
Reversal patterns signal that the trend is about to change direction. If prices are rising, a reversal pattern could mean they’re about to fall (and vice versa).
Common reversal patterns include:
Head and Shoulders
Double Top and Double Bottom
Rising and Falling Wedges
5. Continuation Patterns
Continuation patterns suggest that the existing trend is likely to keep going. These are useful for traders who want to ride an ongoing trend.
Popular continuation patterns include:
Triangles (Symmetrical, Ascending, Descending)
Flags and Pennants
Cup and Handle
6. Head and Shoulders Pattern
The Head and Shoulders pattern is one of the most reliable reversal signals. It looks like a person with two shoulders and a head in between. Here’s what it means:
The left shoulder forms as prices rise and then dip slightly.
The head is a higher peak, followed by a decline.
The right shoulder mirrors the first, signaling a potential downward reversal.
7. Double Top and Double Bottom
Double Top: This pattern looks like an "M" and signals a bearish reversal when prices hit resistance twice.
Double Bottom: Resembling a "W", it indicates a bullish reversal when prices find support at the same level twice.
8. Triangles: Symmetrical, Ascending, and Descending
Triangles are continuation patterns that form as price movements narrow over time.
Symmetrical Triangle: Indicates consolidation before a breakout in either direction.
Ascending Triangle: Bullish pattern with a flat top and rising bottom.
Descending Triangle: Bearish pattern with a flat bottom and declining highs.
9. Flags and Pennants
Flags and pennants are short-term continuation patterns that follow a sharp price movement.
Flags: Form a rectangular, sloping shape against the trend.
Pennants: Look like small triangles and signal a brief pause before the trend resumes.
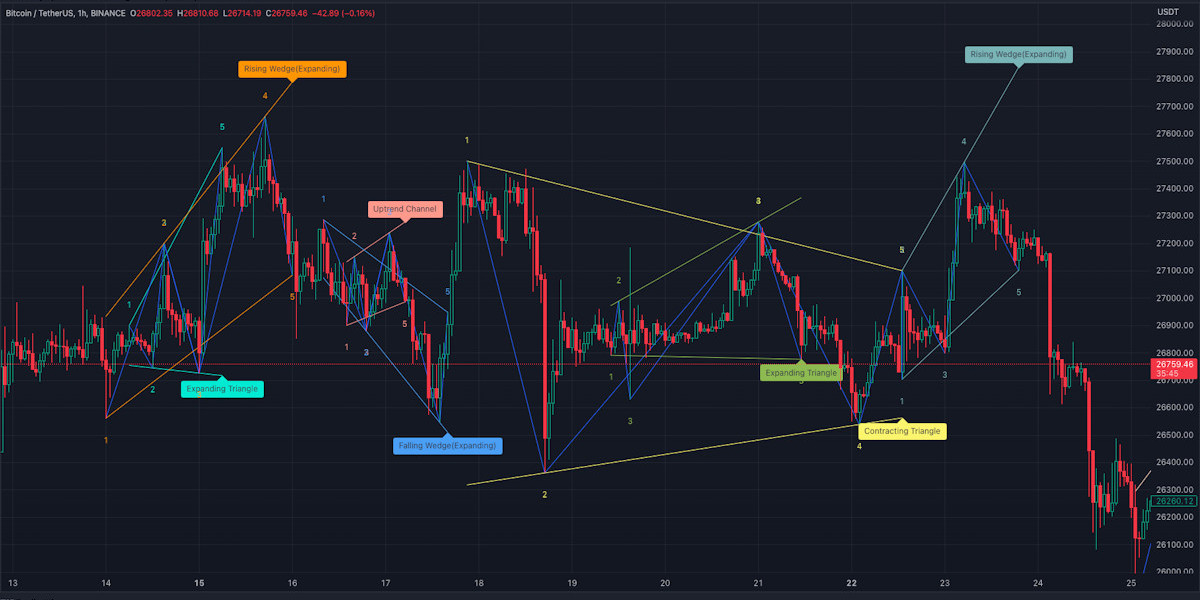
10. Wedges: Rising and Falling
Wedges are reversal patterns that show a narrowing price range.
Rising Wedge: Signals a bearish reversal as prices move upward but lose momentum.
Falling Wedge: Indicates a bullish reversal as prices decline but start to stabilize.
11. Cup and Handle Pattern
The Cup and Handle is a bullish continuation pattern. It looks like a teacup, with a rounded bottom (cup) followed by a small dip (handle). This suggests prices may break upward after a brief pause.
12. How to Spot Patterns on Charts
Learning to spot patterns takes practice. Start by:
Analyzing historical charts.
Looking for shapes like triangles, "M"s, or "W"s.
Using tools like trendlines and support/resistance levels.
13. Tips to Use Chart Patterns Effectively
Combine chart patterns with other indicators (like moving averages).
Focus on timeframes that match your trading style.
Always confirm patterns before making a trade.
14. Common Mistakes to Avoid
Overtrading: Don’t trade every pattern you see.
Ignoring Context: Consider the overall trend and volume.
Forcing Patterns: Don’t assume a pattern exists if it’s unclear.
15. Conclusion
Mastering chart patterns is like learning a new language it takes time but can transform your trading strategy. By understanding key patterns like Head and Shoulders, Triangles, and Flags, you’ll make smarter, more confident decisions in the market. Remember, practice is key!
FAQs
1. What are the best chart patterns for beginners?
Beginners should start with simple patterns like Double Tops, Double Bottoms, and Triangles.
2. How do I confirm a chart pattern?
Look for confirmation signals such as increased volume or other technical indicators like support and resistance.
3. Can chart patterns predict stock prices?
Chart patterns don’t guarantee results but provide valuable clues about potential price movements.
4. How reliable are reversal patterns?
Reversal patterns are fairly reliable but work best when confirmed by other indicators.
5. Do chart patterns work for all timeframes?
Yes, chart patterns can be applied across various timeframes, but their effectiveness may vary based on the market condition.


