
Introduction
Digital transformation is introducing advanced scalability metrics to monitor applications. These days, attaining peak database scalability is just a few steps away with smart thinking and collaboration with the right software product engineering services!
Database scalability, in particular, refers to its uniform ability to handle increased data volumes efficiently. Mostly, scalability considerations in the API design or system require advanced tools for infrastructure scaling and monitoring.
But there are certain dos and don'ts of this process that businesses must understand to scale their system well. We will decode them all for you here in this blog—
What are System Scalability Metrics?
Scalability metrics, or application metrics, are also known as application performance monitoring (APM) metrics.
They are quantitative values to track and manage system performance. APM is the prime scalability metric to monitor in applications. They monitor every single aspect of system performance, including system reliability, resource utilization, and responsiveness.
Understanding System Scalability Metrics in Different Platforms
Certain businesses face more issues with scalability, such as scalability challenges in e-commerce platforms. Utilizing APM for such frequent work and complex systems provides valuable insights for ideal scalability metrics.
Earlier, one of the main challenges in IoT applications used to be storage and seamless processing. But with the introduction of cloud-based SaaS, it's now much easier to maintain data and replicate whenever the system feels it needs to. Also, the SaaS market is on a new hit-making spree of 299 billion USD by 2025!
In your effort to configure scalability metrics to monitor in applications, you must understand that monitoring everything will be time-consuming. Thus, tracking the right scalability metrics makes up for the answer.
Top Scalability Metrics to Monitor in A System
Here are the most worthy scalability metrics to monitor in applications to help you attain better business insights—
Response Time
Or, Average Response Time is a critical metric that aids in system capacity planning and resource allocation.
Throughput
This directly impacts the user experience, and measuring it can be acquired through various monitoring methods.
Apdex and SLA Scores
Apdex (Application Performance Index) and SLA (Service Level Agreement) are metrics for analyzing user satisfaction.
Resource Utilization
It indicates how much processing power and resources a system consumes.
Error Rate
Identifying system errors is important for maintaining the system's reliability. It allows testers to identify and fix bugs for improvements.
Although there are more scalability metrics to monitor in applications, let's focus on our topic for now in this blog.
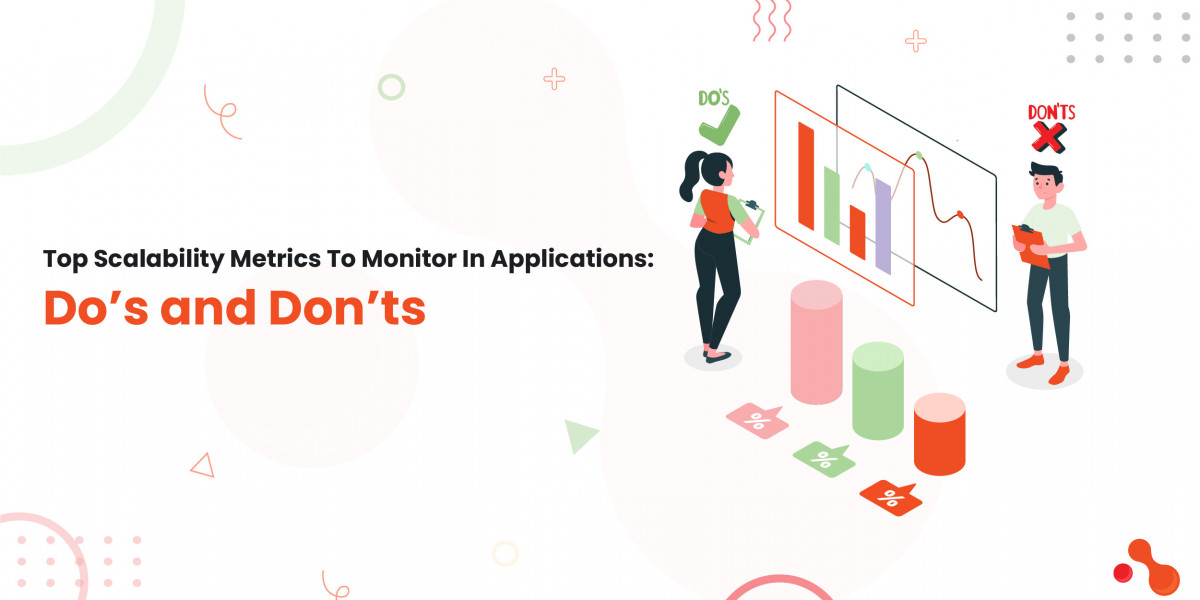
Dos: Scalability Metrics to Monitor
CPU and Memory Utilization Monitoring (Resource Utilization)
It is a crucial element for identifying resource bottlenecks and other issues within the system. A highly utilized, sustained CPU may signal the need to scale and adopt practical approaches and tools for monitoring. Above all, regular resource monitoring helps optimize the system's performance.
Best Practices:
- Regularly audit resource allocation policies.
- Set up smart system alerts for resource usage thresholds.
- Configure alerts on job queue length, error rates, or CPU spikes.
- Monitor CPU/memory usage across nodes, services, and clusters.
- Adopt advanced mechanisms to prevent system outages.
- Use data history to predict scaling issues and priorities.
- Adopt tools like CloudWatch, Prometheus + Grafana, New Relic, and Datadog.
Track Throughput, Latency, Queue Depths
Tracking throughput and queue depths will let you know the exact requests/queries per second and traffic per node. Tracking system latency will determine the average API response time and indicate potential performance bottlenecks due to P95 and P99 latency.
If queue length continues to grow, then failed job processing rates and time to complete the task will also increase abruptly.
Best practices:
- Actively monitor database query performance and execution time, connections used, and cache rates.
- Track all metrics across resources like CPU, memory, I/O, database connection pools, and user experience.
- Determine page load time, error rates, and how well the system holds itself when under pressure.
- Use tools like New Relic, APMTools, K6.6, Laravel Horizon, SQS Metrics, Sidekiq Dashboard, Prometheus, Cloudflare Analytics, Grafana, pg_stat_statements (PostgreSQL), and MySQL slow query logs, etc.
Monitor auto-scaling triggers and costs
To identify underlying common scalability issues, you must also monitor auto-scaling trigger points and the time taken by the system to scale. Misconfigured auto-scaling can result in significant costs, including overspending, outages, and budget overruns.
You must especially monitor cloud spending trends and resource usage and tie them all to your cost optimization efforts!
Best practices:
- Monitor scaling event logs and post-scale resource utilization.
- Scaling is about sustainable performance, so set system uptime/downtime alerts, incident response time, and availability thresholds.
- Use Percentile-Based Monitoring (P95/P99) to identify the slowest user experience and hidden critical spikes.
- Embrace advanced tools like AWS Auto Scaling, Kubernetes HPA Metrics, Pingdom, StatusCake, and Uptime Robot.
Integrate metrics and perform stress tests.
In the system, you should integrate metrics with proper logs and traces; this helps to pinpoint the root cause faster. These metrics easily identify common scalability issues and detect even the slightest anomalies. Performing a system stress test determines how much pressure it can handle before crashing or undergoing downtime.
Best practices:
- Utilize scalability benchmarking tools and services before launching your product/system.
- Perform amid scaling experiments and infra changes to configure where your system stands.
- Use platforms like OpenTelemetry, ELK Stack, Sentry, or Jaeger to integrate metrics.
- Use tools like k6, JMeter, or Locust to simulate load.
Don’ts: Scalability Metrics to Monitor
Common Scalability Issues and Pitfalls to Not Ignore include these many elements stated as under—
Don't rely on basic monitoring results.
Always monitor in-depth percentiles (P95, P99) to detect tail-end latency and system bottlenecks.
Don’t track everything.
Monitoring too many irrelevant metrics will cost you time, effort, and money. It also leads to system fatigue.
Don’t ignore trends.
Watch out for trend lines along with thresholds, as mere point-in-time statistics don't figure out system degradation.
Don’t get confused between high traffic and system scalability.
High traffic ≠ scalability success.
Don’t neglect the alert configuration.
You need to look beyond the dashboard and set up real-time system alerts!
Don’t neglect frontend metrics either.
Without the front end, the backend scaling will not be fully achieved. Use tools like Google Lighthouse, Web Vitals, and Sentry for optimizing the front end.
System-level metrics are not enough.
Infra metrics with application context to detect API timeouts or database lockups.
Don’t let go of slow user experiences.
A bug number is a collection of small numbers; take it seriously even if 5% of slow user experiences get reported within your system!
Don’t overload your system.
Having too many dashboards impacts system availability and functioning.
Don’t Set irrelevant alerts.
Setting up system alerts without response plans misses its clarity. It's not to be set just for awareness but with an action.
Don’t wait for frustrated users.
If your users notice a problem with the system, then you have already lost their trust. So proactively monitor API SLAs and real user monitoring (RUM).
Bottomline
The above-mentioned scalability metrics to monitor in applications help businesses a lot and in many ways. From identifying system bottlenecks to ensuring optimal system performance and user experiences, you can achieve everything with APM!
So that's almost everything we've covered in our blog here! You can detect system issues early, maintain its reliability, and optimize resource allocation according to the workloads. With continuous APM analyses, the team can cross-function and collaborate in a better way to make more informed decisions. They can also prioritize system performance improvements and measure and manage system monitoring needs accordingly to streamline the overall system processing.
FAQs
Can I scale a microservice architecture?
Of course you can scale a microservice architecture, and if you consult experts from a software product engineering company, then things can get even better!
Be it a monolith system architecture or microservice, you can implement scaling for both of them. However, first you must get to know the basics about scalability in microservice vs. monolith architecture.
How to effectively plan for software scalability?
Likewise, in our blog mentioned above, you must know everything about the
dos and don'ts of software scalability. This way, you can get a better understanding of all the basics that are relevant to the topic.
Source : https://mukeshram.hashnode.dev/top-scalability-metrics-to-monitor-in-applications-dos-and-donts